Retention report: Can you retain customers?
Zasoby marketingowe
Finteza analytical system now includes a new report — Retention. It helps to understand how good you are at retaining certain type of customers. The report shows how often a certain group of users repeat certain actions in a site or in an application. This information allows interacting with your audience more efficiently, as well as objectively evaluating the results of your marketing activities and changes in your site.
Let's go through a simple example — imagine a pizza shop website allowing visitors to place an order online. Last month, the shop held a promotion — two pizzas for the price of one. Clearly, the company did not just want to sell more products, but was looking for new customers willing to constantly order pizza. On the day of the promotion, the shop revenue skyrocketed, the site saw an influx of new visitors and the number of orders naturally increased. Thus, the promotion was very successful. The owner needs to evaluate what actually happened and how many new customers the company attracted. After all, the New Year is coming soon and it would be reasonable to run another promotion since the previous one went so well.

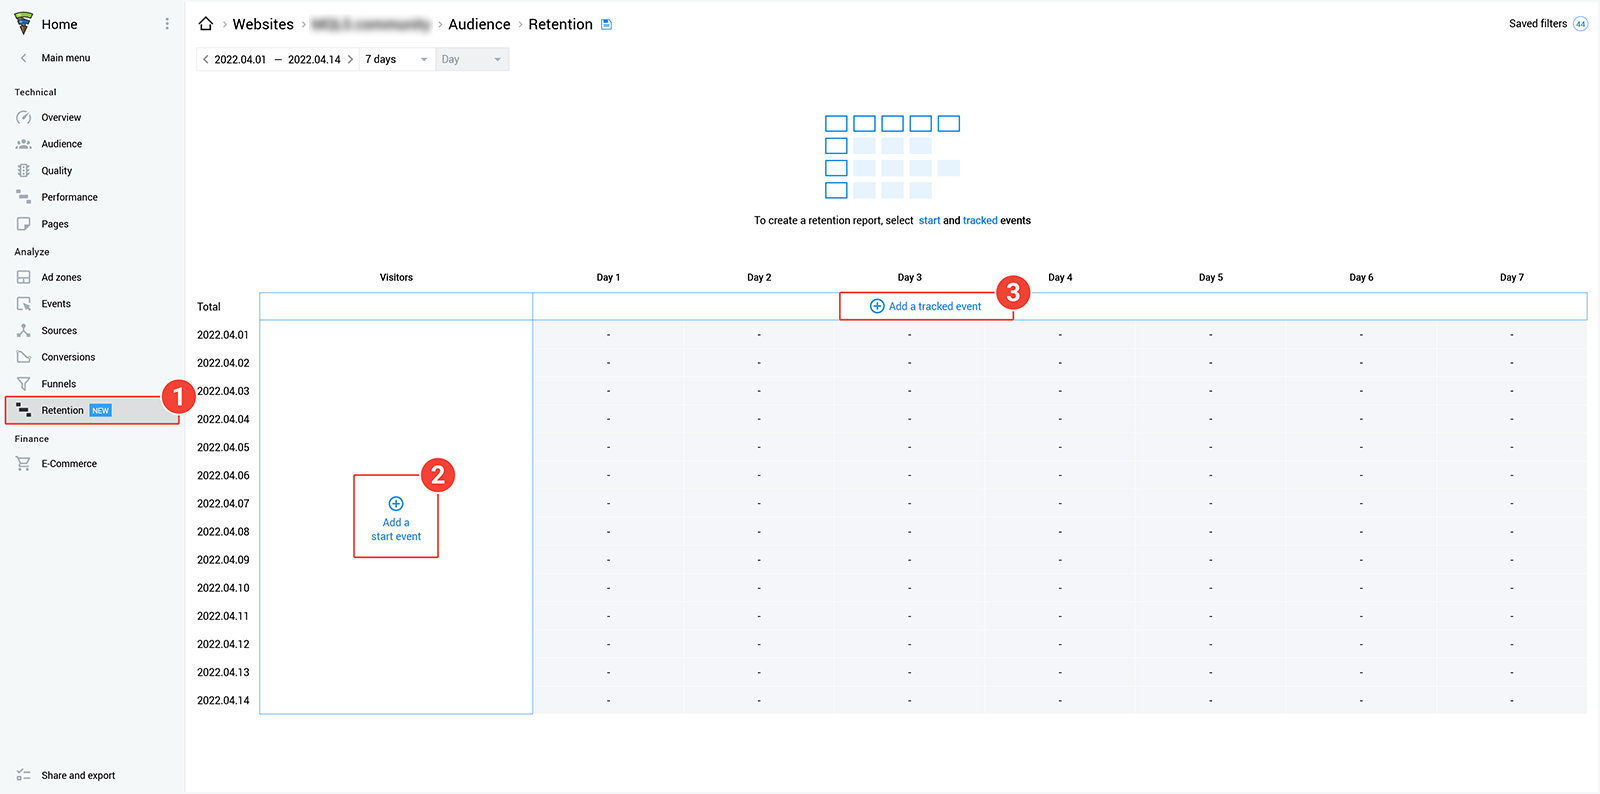
The new Finteza report called Retention will help to understand the situation. How it works? First, you define some event, according to which you form a category of users. It is called a Start Event. In the case of the pizza shop, we need users who registered in the site on the day of the promotion. Then we mark the events we are going to follow. They are called Tracked Events. In our case, we will track repeated orders.
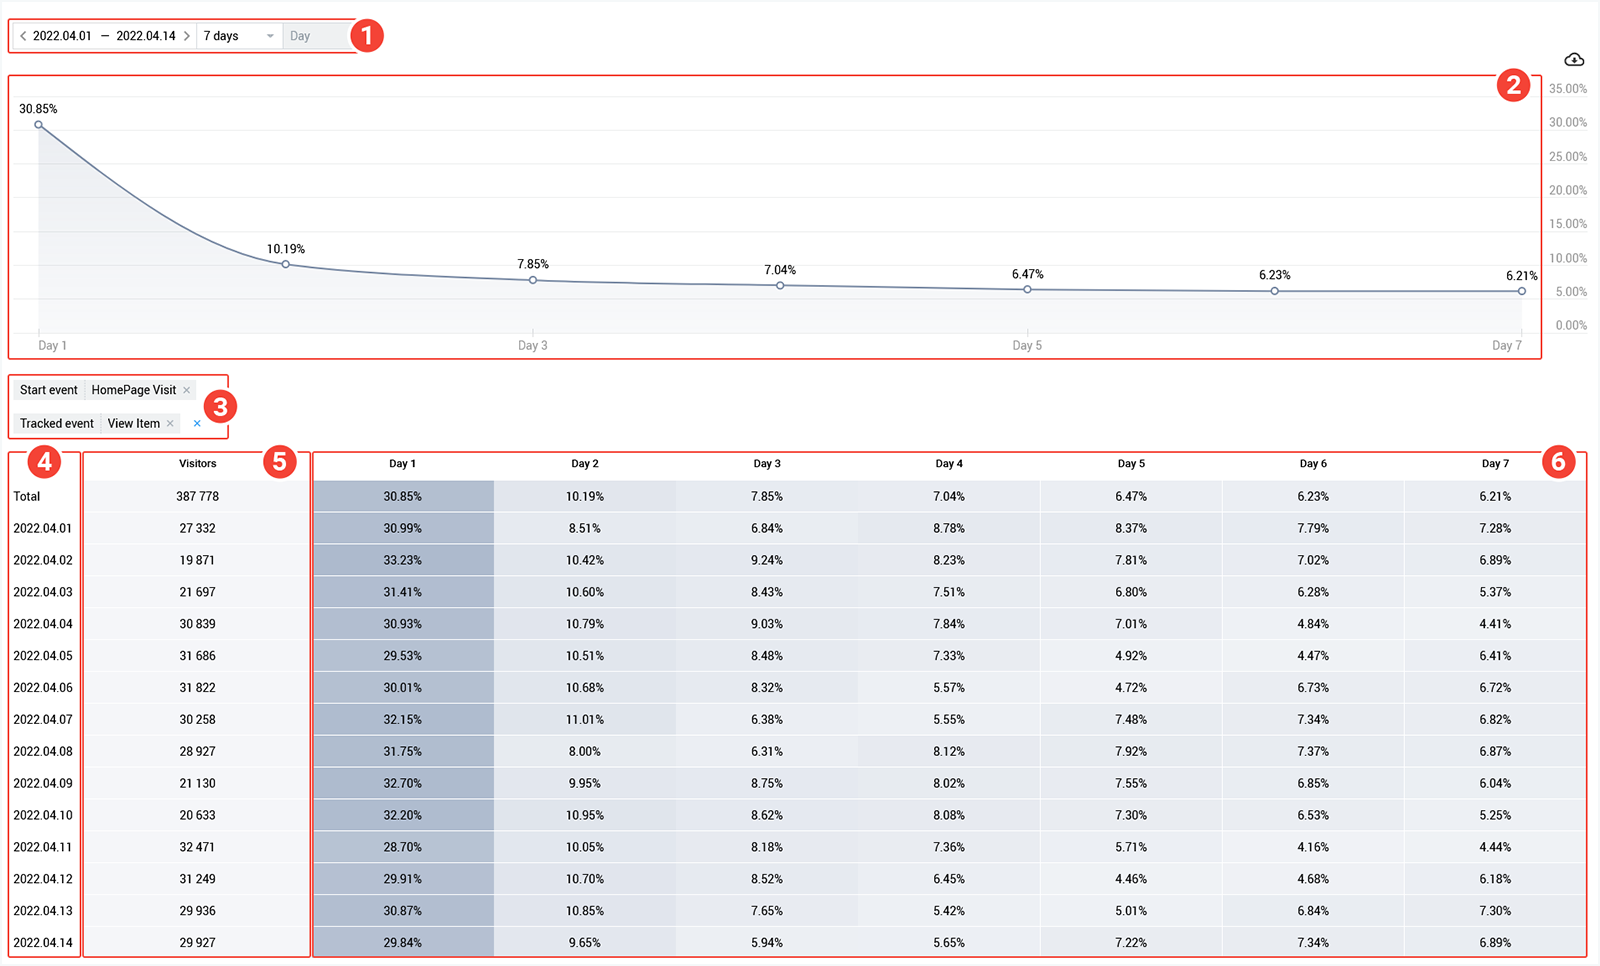
The structure of the resulting report is as follows:

- Reporting period.
- The weighted averages distribution for the entire period by days — 30.85% of users completed the Tracked Event on the first day, 10.19% on the second, 7.85% on the third, and so on.
- Your Start and Tracked Events.
- Start Event date for detailing the report on specific days.
- Number of users on that day.
- Percentage of category users who completed a Tracked Event on a specific day after the Start Event date.
Now the pizza shop owner can create a report for the past month and extract, for example, that those who visited the site on the day of the promotion just wanted to get a free pizza and never returned. Put into perspective, the day's metrics show the same number of repetitive customers as seen during a typical day. This means that the promotion actually failed while looking successful macroscopically. However, the pizza shop owner abandoned the idea of the New Year promotion and avoided negative cash flows. The owner will have to look for other methods to increase clientele.
Most importantly, you can use not only standard ecommerce events but also create custom ones allowing you to track the behavior of any user groups and combine any events as per your needs. You can combine the Retention report with other filters to extract audience insights. For example, you are able to sort your visitors by geographical region or by used devices. In addition, you can set an arbitrary number of Start and Tracked Events. For example, you can mark two Tracked Events — page view and product order. In this case, the system will show when a user either visited the page, or purchased a product.

The Retention report solves many important tasks and is useful for almost all members of your team — from executives and marketing managers to sales representatives and UX specialists:
- Evaluate the prospects of your projects and promotions — whether they are worth supporting or whether it is more reasonable to abandon
- See how changes in the site work — how audience behavior has changed after you redesigned the interface or functionality
- Calculate the cost of increasing your customer base — predict audience growth and set it against the associated costs
- Define Product Market Fit — one of the key indicators of product success and viability
Retention rate is a key indicator for any business. Use the new Finteza report to correctly evaluate the results of marketing promotions and technical changes in your projects. This will allow you to timely notice negative and positive changes in user behavior, effectively utilize your advertising budget and make long-term forecasts regarding product scalability and payback.


