How to optimize adverts and maximize ROI (ROAS)
منابع بازاریابی
Ad traffic managers usually deal with dozens of advertising campaigns, while their primary purpose is to optimize adverts and maximize results.
Let's consider an example of an advertising campaign launched on Facebook and Google Ads in Canada. To optimize the campaign, we will disable all channels which cost more than 3 USD per purchase. Let's see how this can be done using Finteza's Conversion Funnels.
Conversion funnels show the user conversion path from the first visit to
purchase
Prior to purchasing the traffic, two preliminary steps must be completed:
1. Mark sources with UTM tags.
We recommend marking advertising materials as follows:
- utm_source for the traffic source
- utm_campaign for the campaign name
- utm_medium for the ad type: display, price, retargeting, affiliate, qrcode, social_cpc, social_post, special
- utm_term can be used for keywords
- utm_content for the content type usually used in paid advertising
2. Enable event registering on your site.
Finteza requires data on occurring events, based on which a conversion funnel can be built. Event tracking does not slow down site operation and it does not affect performance. Check out the instruction or share it with the site developer.
The service can handle every action, such as button clicks, online assistant dialog start, purchases and shopping cart visits. The relevant data is registered directly in the system.
Optimization
1. Build a Sales Funnel.
Select Funnels from the side menu and click Create Funnel. Select the desired stages from the list of available events and pages.
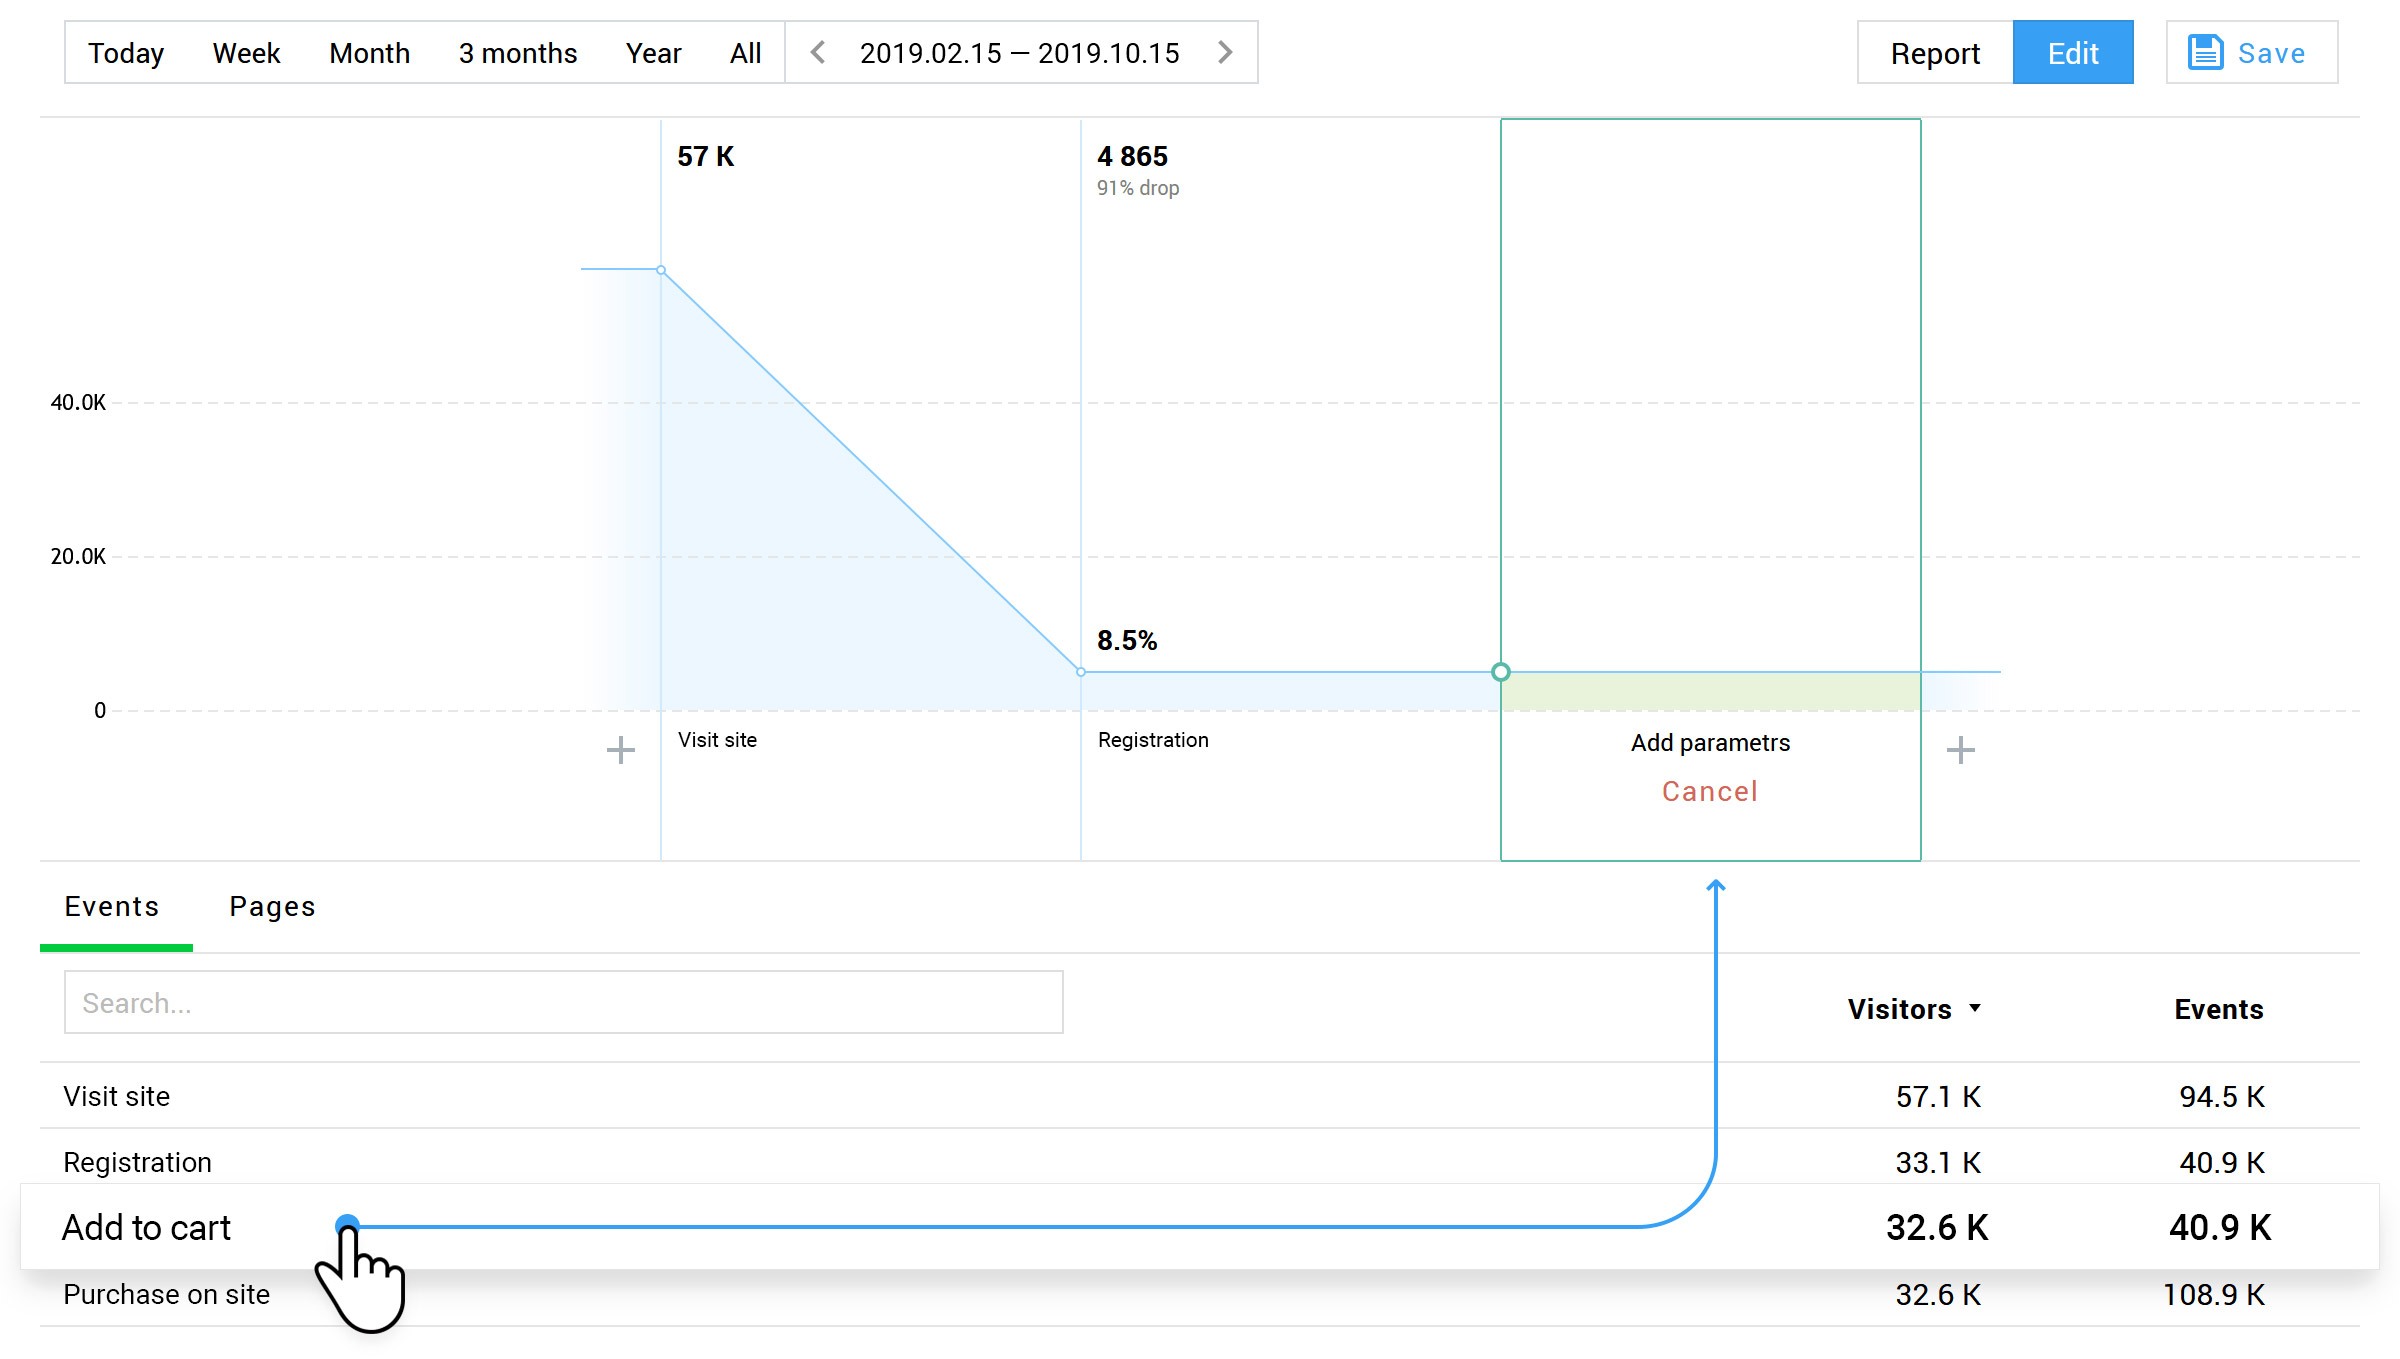
Four stages have been selected for our example: visit, registration, adding to cart and purchase
Select the key actions which you wish to track and click Report. The service instantly visualizes data and shows a drop in conversion rates. The funnel provides a clear picture of user conversion rates by stages, along with audience loss points and traffic sources.
2. Set specific conditions.
To analyze the advert results in any desired location (in our example, it is Canada), navigate to audience -> countries and select the desired geographical location.
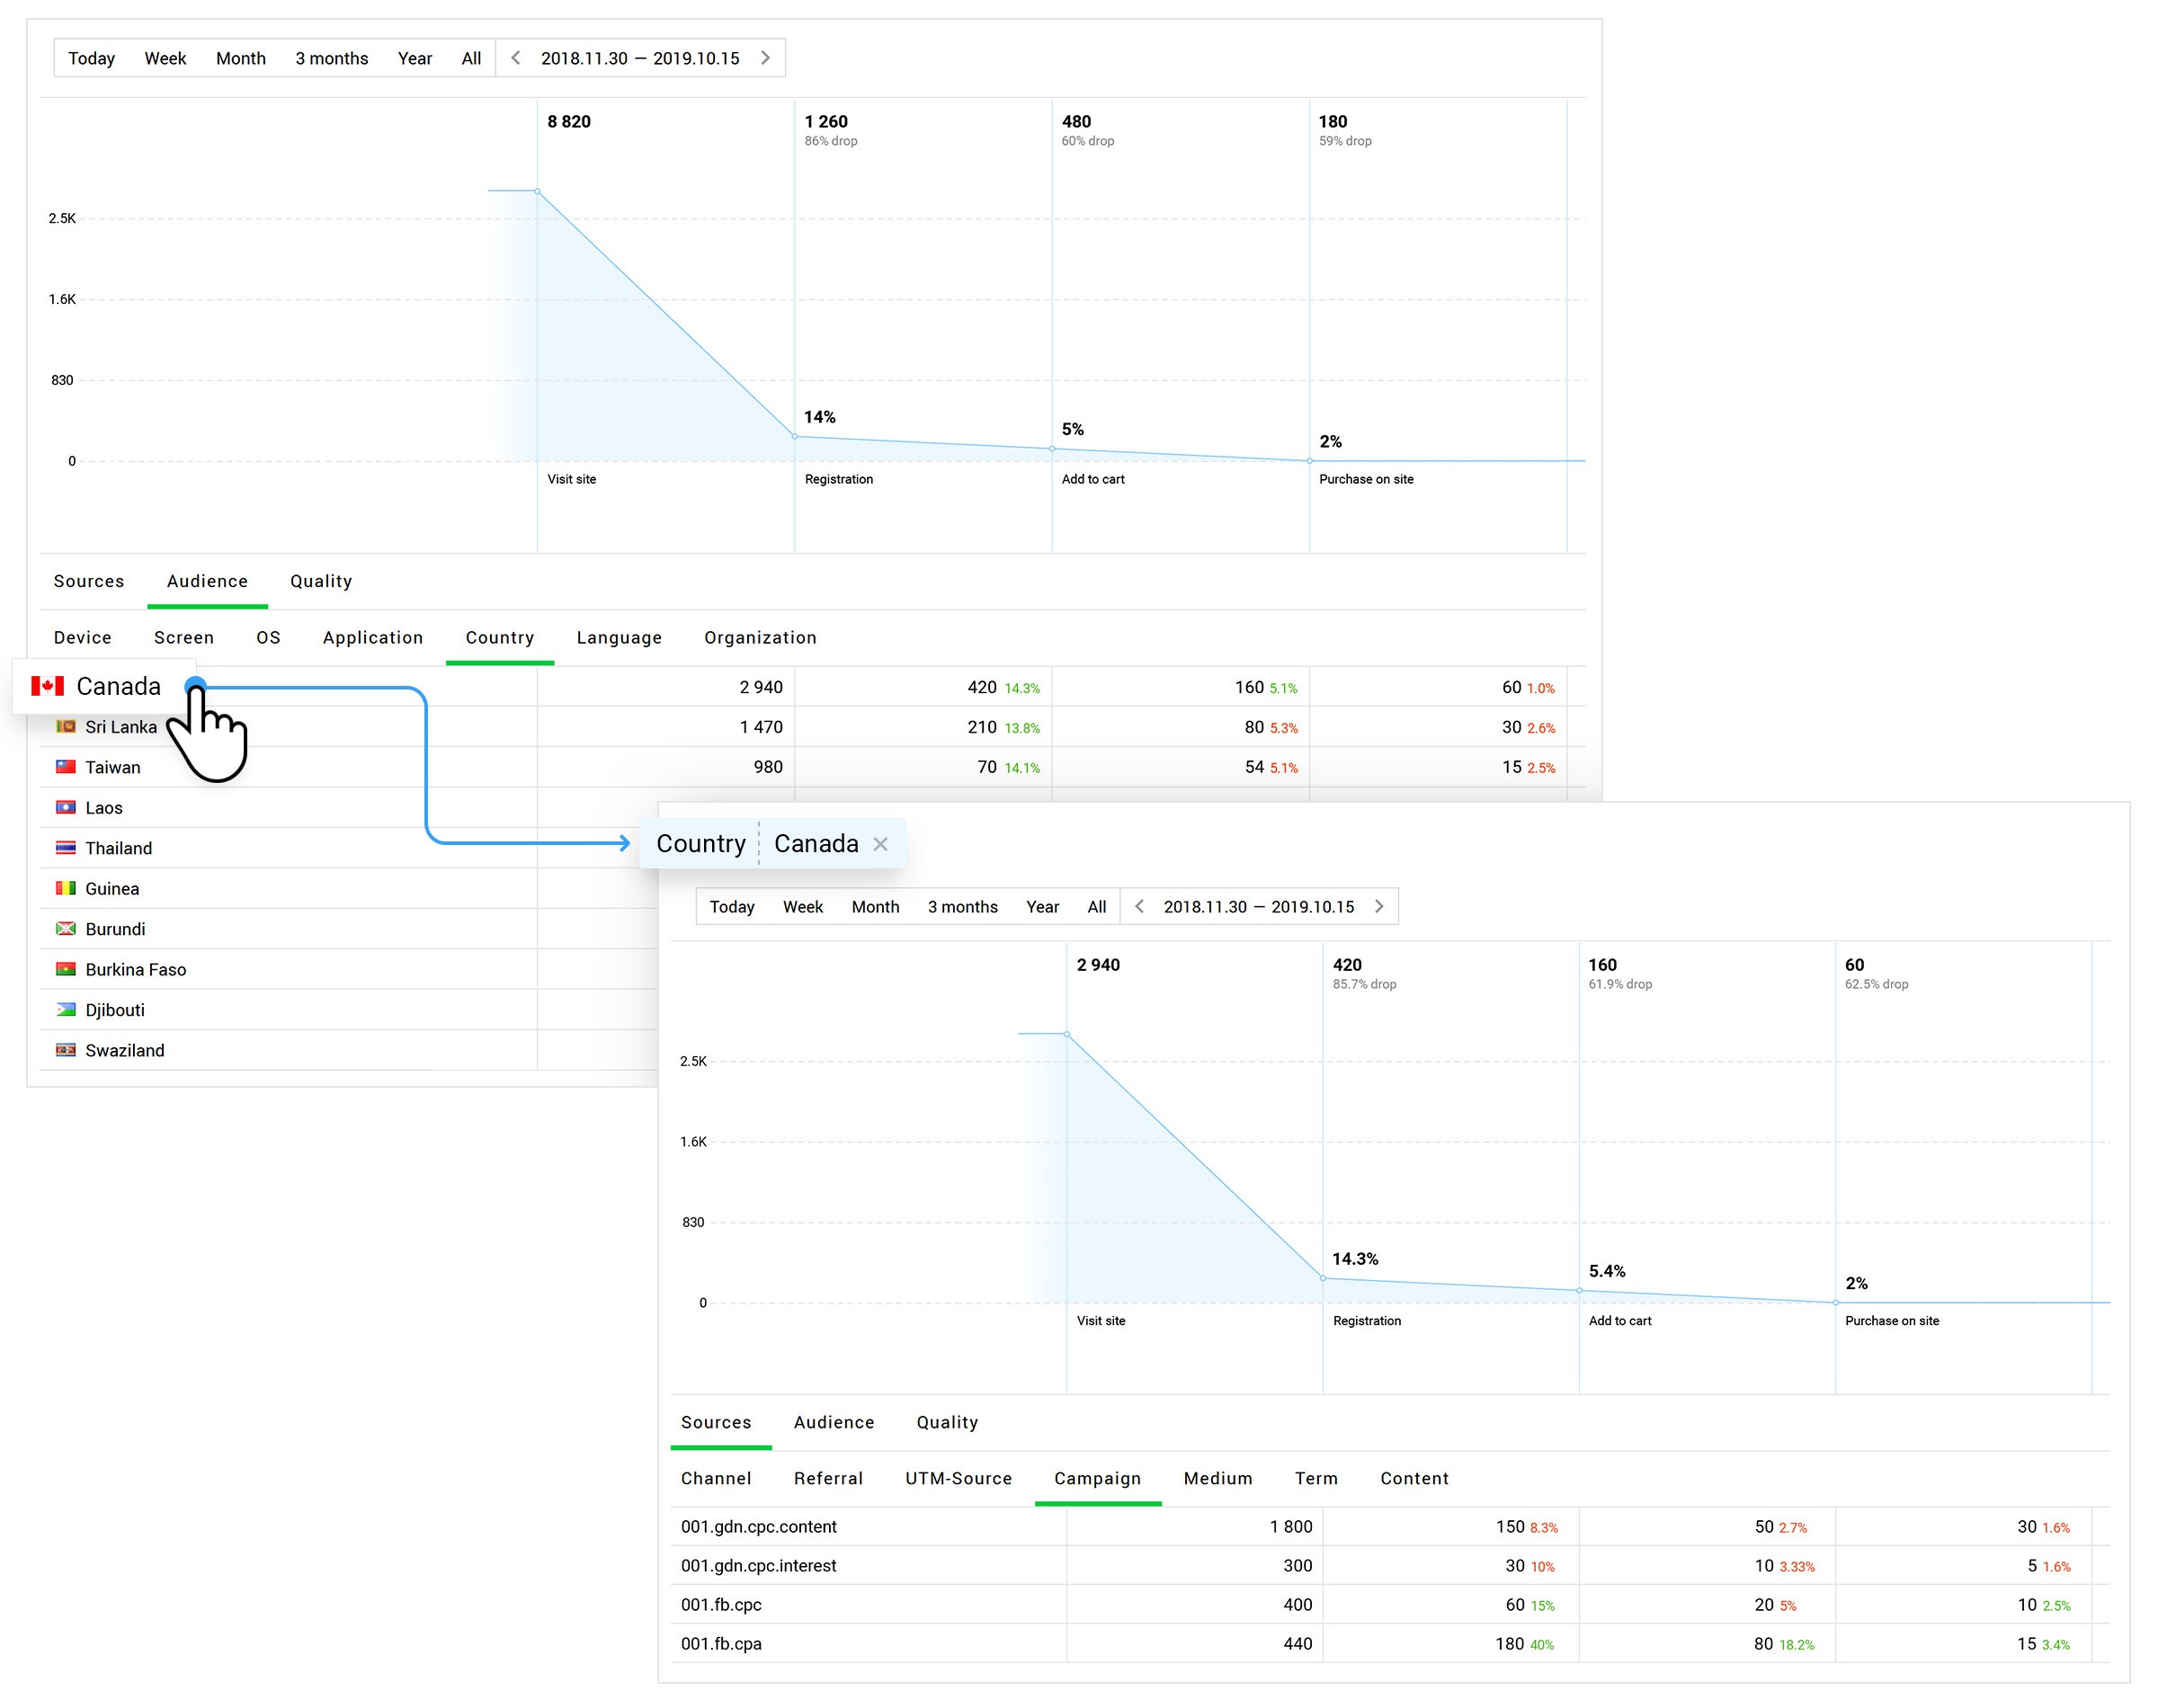
Further filters can be selected to narrow the results down to a specific audience segment
After selecting Canada from the list of countries and applying the filter, the system shows statistics related to this specific geographical location. Finteza enables precise audience selection for the most accurate analysis.
3. The funnel shows the audience path from the first visit to the final stage, while applying different sampling patterns, such as traffic quality, devices, applications, countries, languages, ad formats and sources, among others.
The Quality tab provides traffic breakdown: good, low-quality, invalid and service traffic. In our case, normal-quality traffic resulted
in 59 purchases, one purchase was performed by a low-quality visitor, while the remaining two types generated no results.
The Devices report shows that desktop users produced higher conversion rates than smartphone users. The Medium tab shows that the pay-per-action model generates more sales.
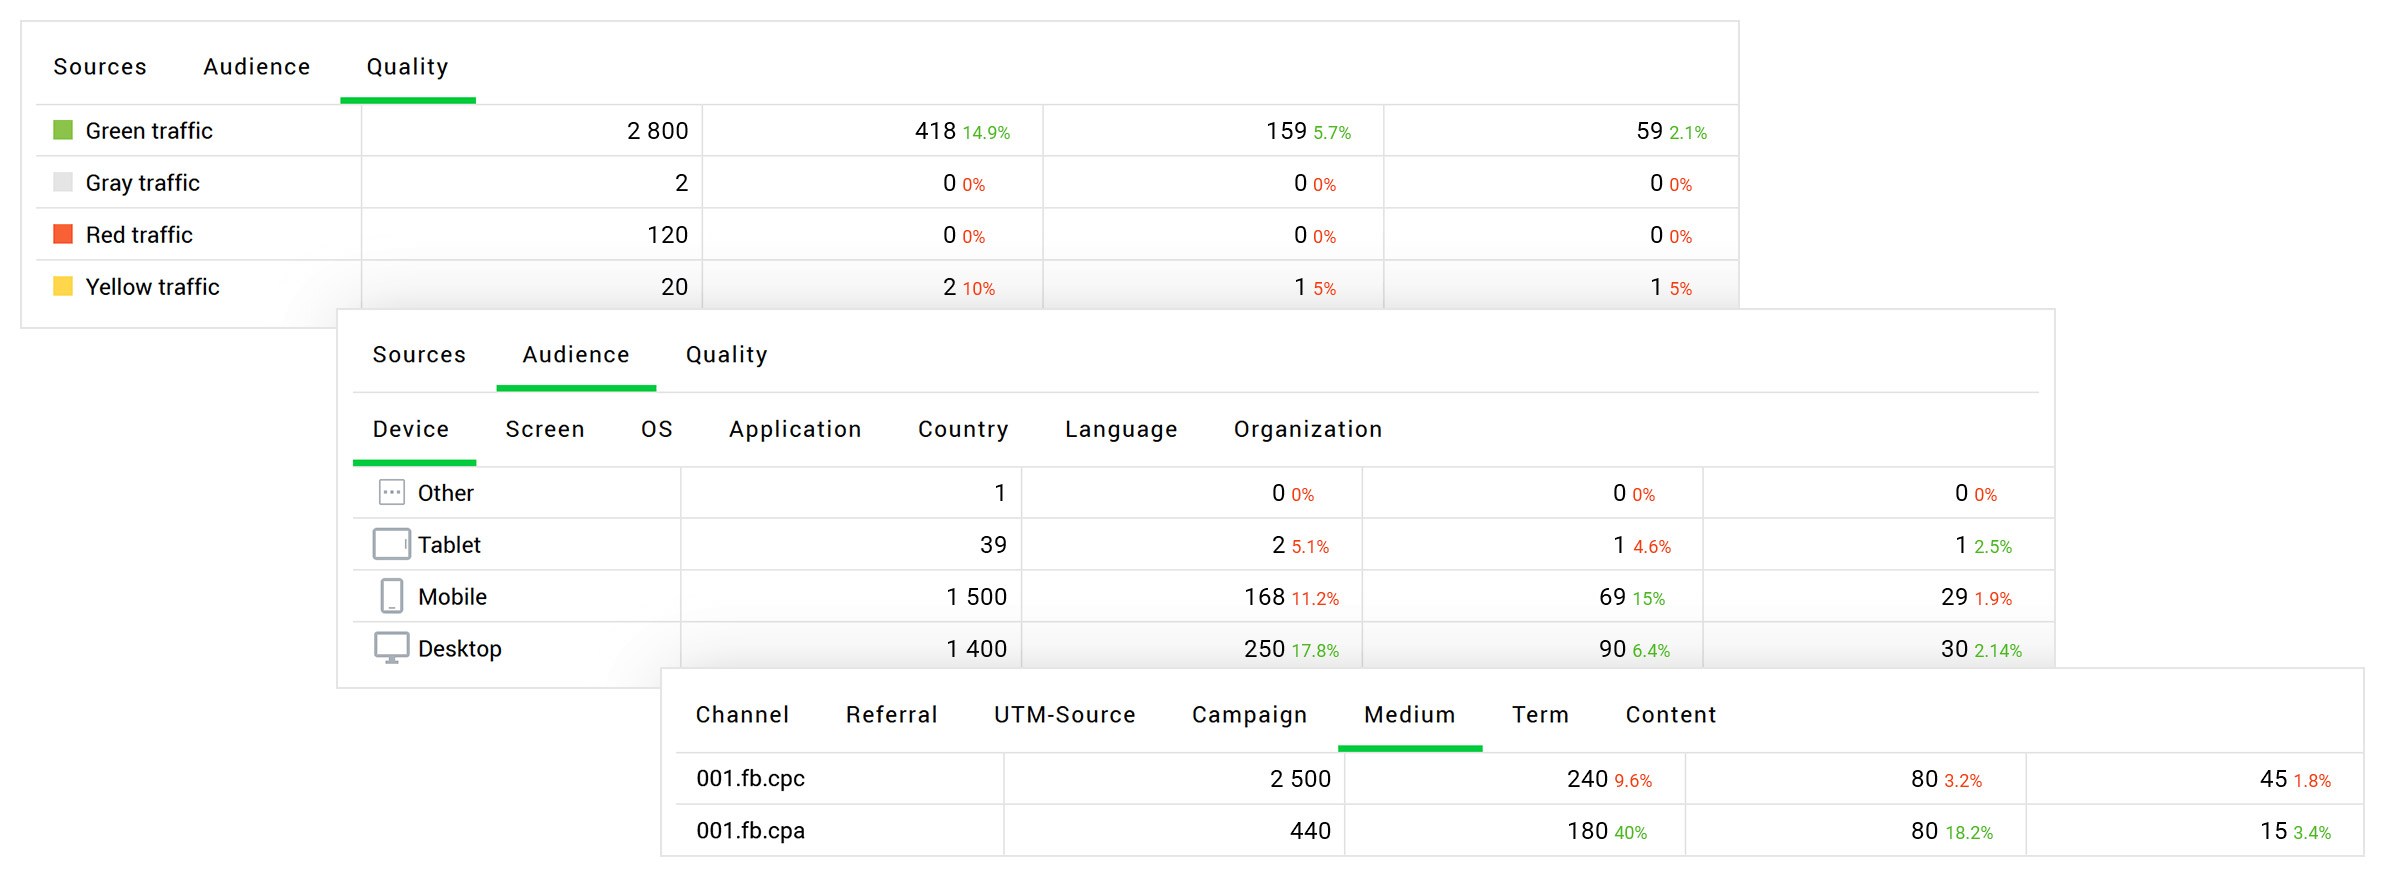
The funnel stages can be viewed in 15 different reports
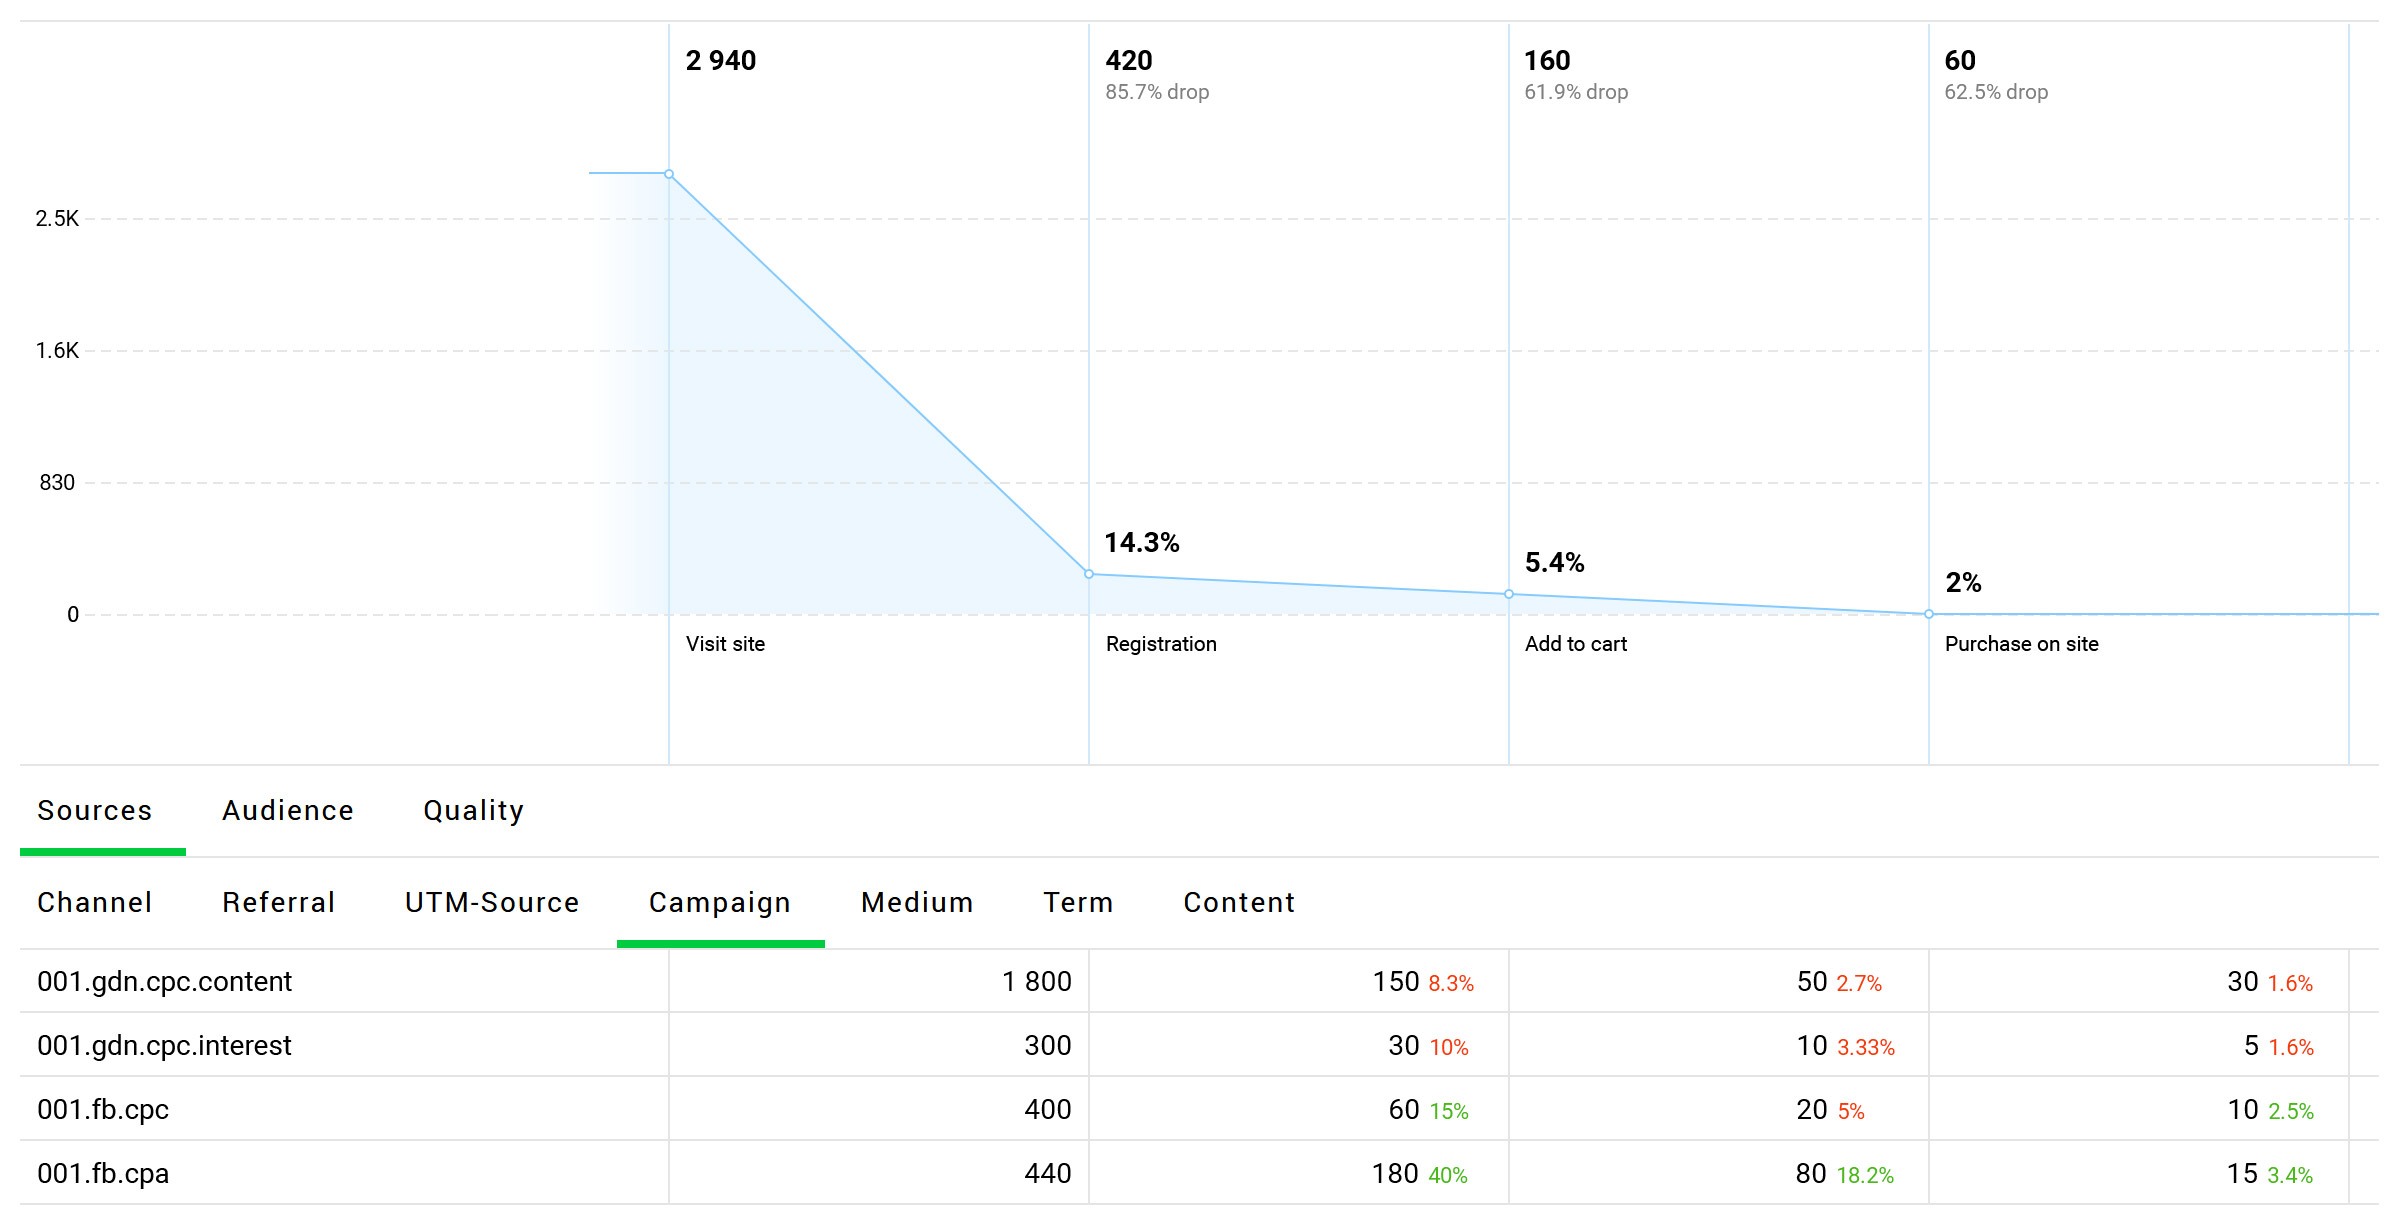
For more efficient data visualization, Finteza calculates conversion rates and presents them in different colors. Values above the stage average are colored in green. Those below the average value appear in red. In our example, the average conversion rate of the registration stage (the second step) is 14.3% and thus the campaign 001.fb.cpa having the conversion rate of 40% is marked with green.
4. Start optimization.
The ad campaign was launched on Facebook and in Google Ads:
- 001.gdn.cpc.content: a pay-per-click campaign in Google, the target action is the website topic click
- 001.gdn.cpc.interest: a pay-per-click campaign in Google, the target is set on audience interest
- 001.fb.cpc: a pay-per-click campaign on Facebook
- 001.fb.cpa: a pay-per-action campaign on Facebook
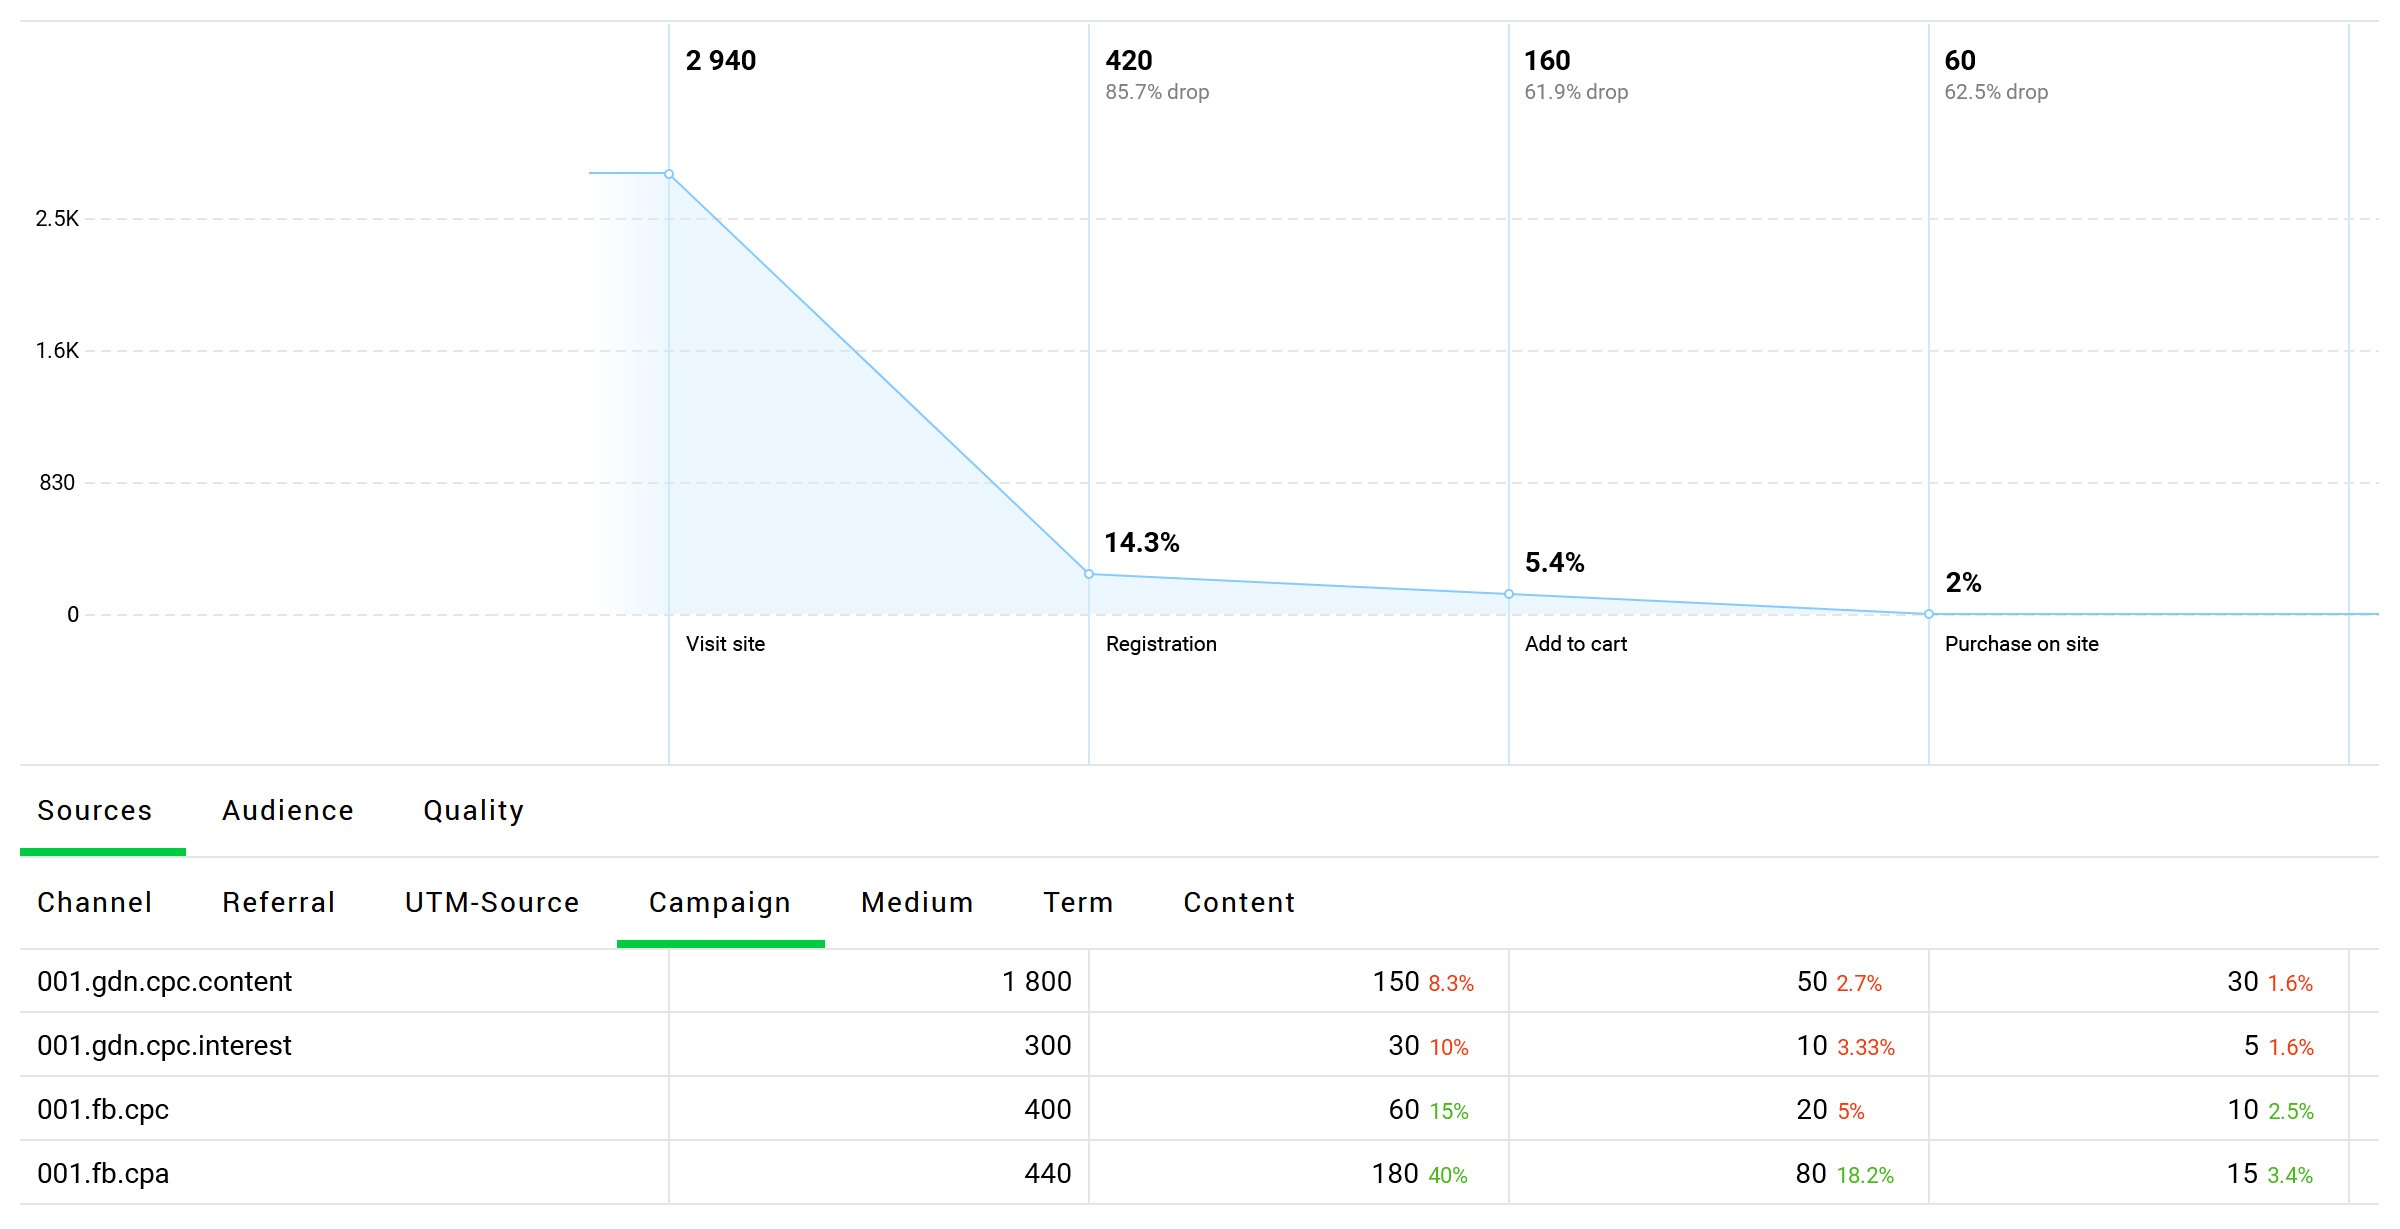
Google Ads and Facebook campaign statistics
The worst final stage conversion results were generated by was 001.gdn.cpc.content and 001.gdn.cpc.interest — 1.6%. The value is less than average and is therefore shown in red. However, we are not interested in the conversion rate, but we need to evaluate marketing costs per purchase. We need to detect loss-making sources.
To do this, create a table to calculate each campaign investments. At the very beginning, we set a goal to eliminate any campaigns in which the final purchase costs more than 3 USD.
| Campaign | Spending, USD | Purchases | Cost per purchase, USD |
|---|---|---|---|
| 001.gdn.cpc.content | 20 | 30 | 0.33 |
| 001.gdn.cpc.interest | 10 | 5 | 2 |
| 001.fb.cpc | 10 | 10 | 1 |
| 001.fb.cpa | 50 | 15 | 3.33 |
To calculate cost per transaction, divide the amount spent by the number of purchases. In the above table, the required condition is not met only in 001.fb.cpa. The cost exceeds 3 USD, so we turn this ad off. The pay-to-action campaign on Facebook is not cost-effective in our case. In all other cases, the resulting costs do not exceed the preset limit: 0.33, 2 and 1 USD. Let these campaigns run further.
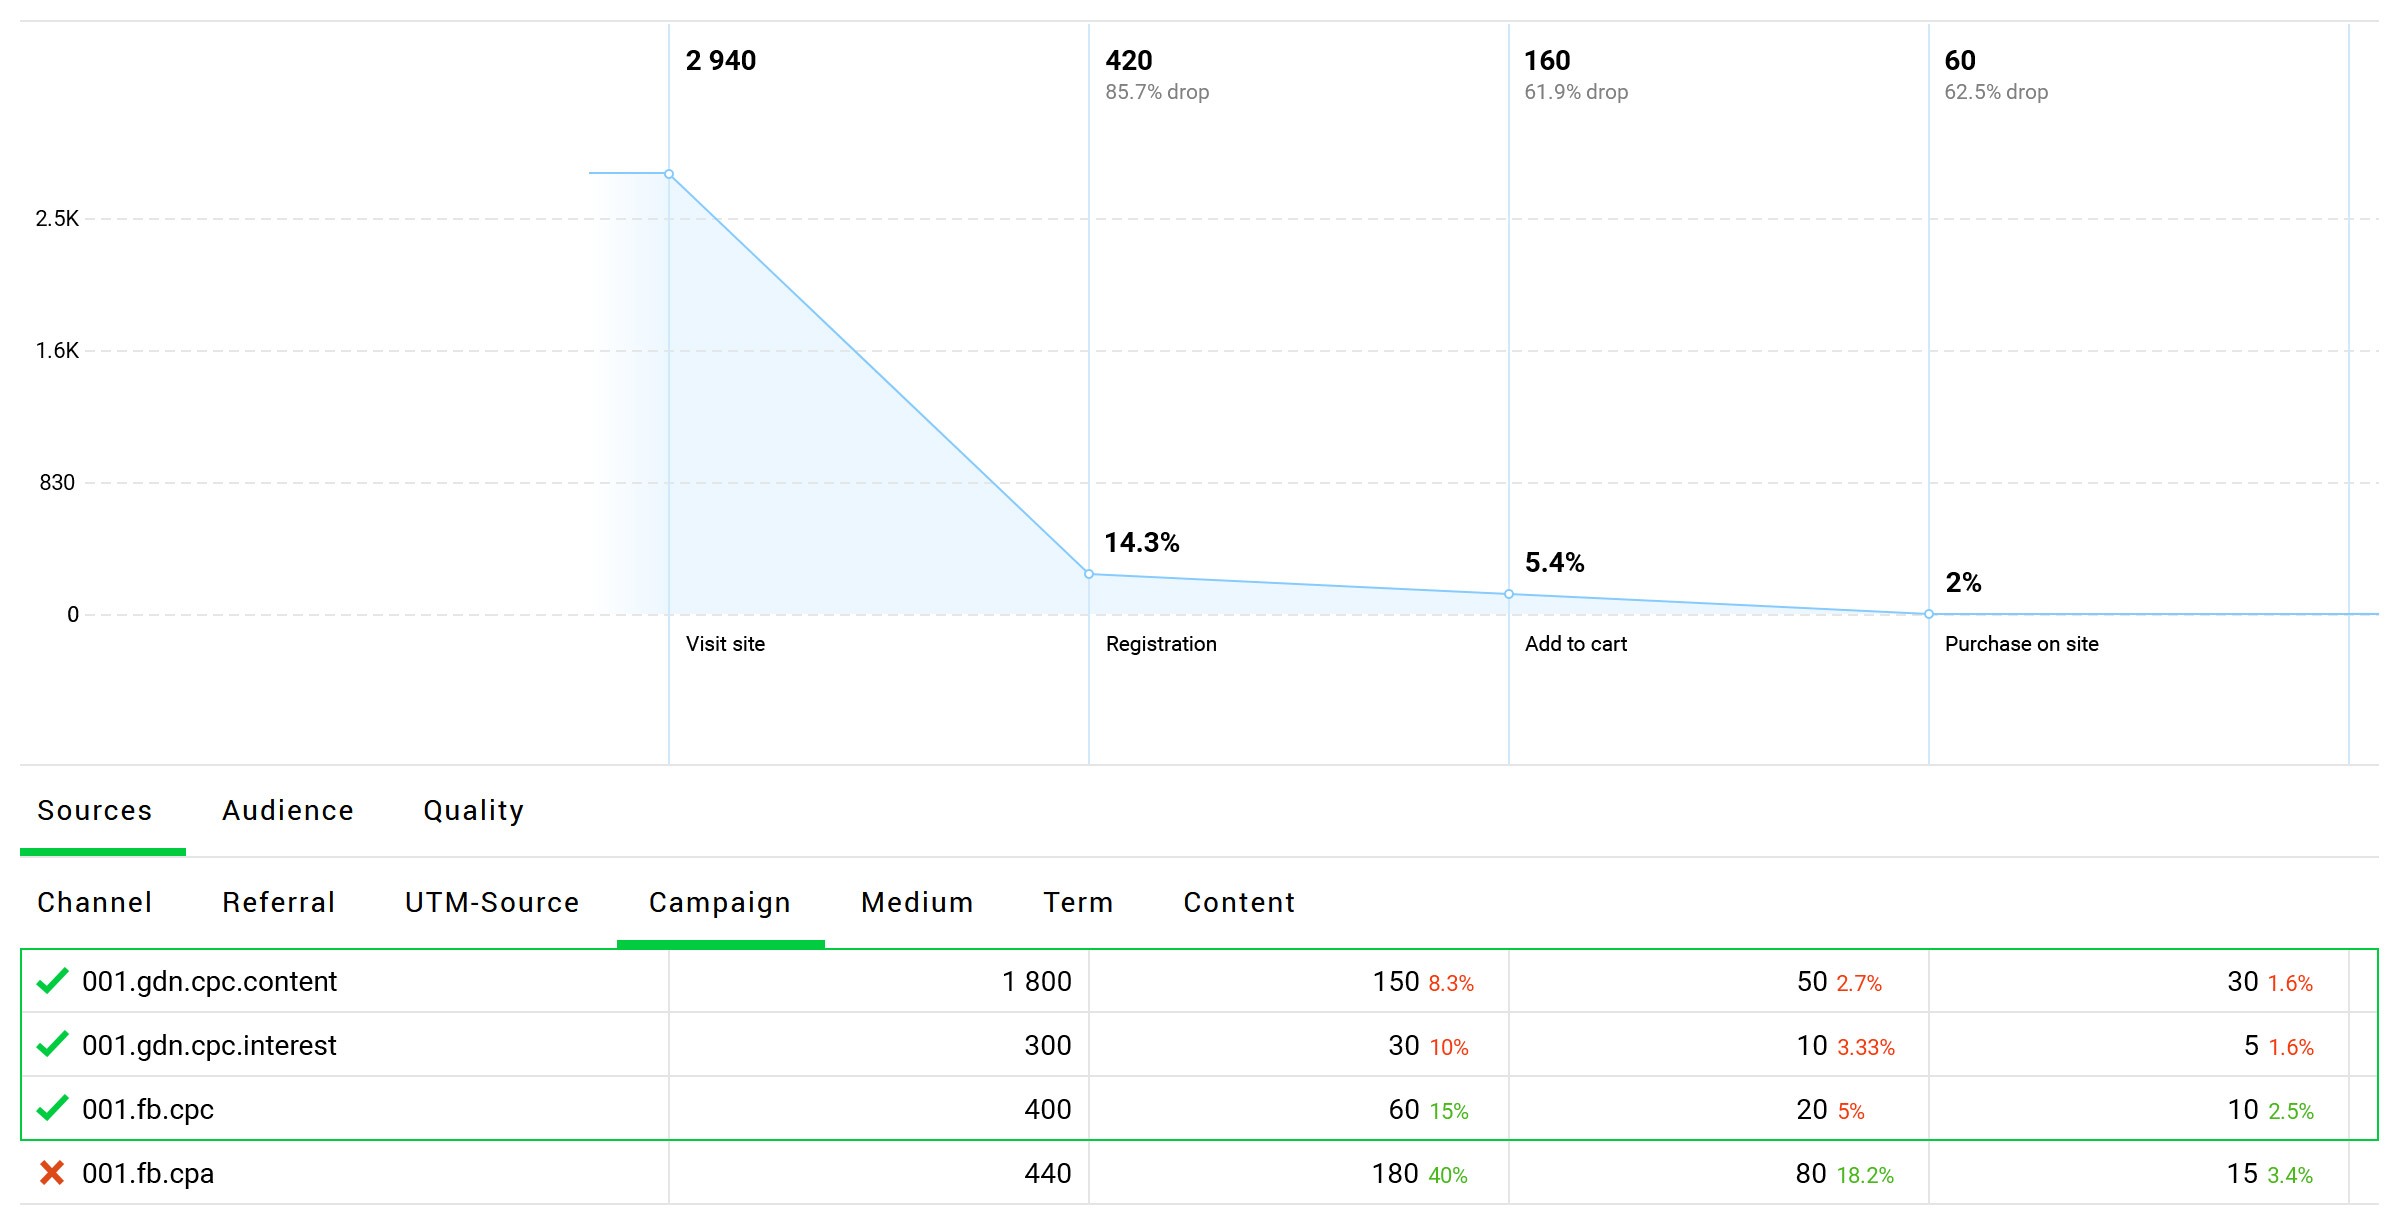
We have determined a bad source to disable
In just a few minutes, we determined a cost-ineffective channel and improved return of marketing investments. Now, every dollar invested generates higher revenue.
Activate a trial period and test the service on your website. Finteza is easy to install and you can start using it without entering payment information. Audit campaigns and disable inefficient traffic sources. Boost your advertising ROI!
