Marketing campaign efficiency
Are your marketing campaigns able to yield the desired reach and revenue? Has the site or banner performance increased? Find answers to the aforementioned questions using marketing campaign reach metrics in Finteza.

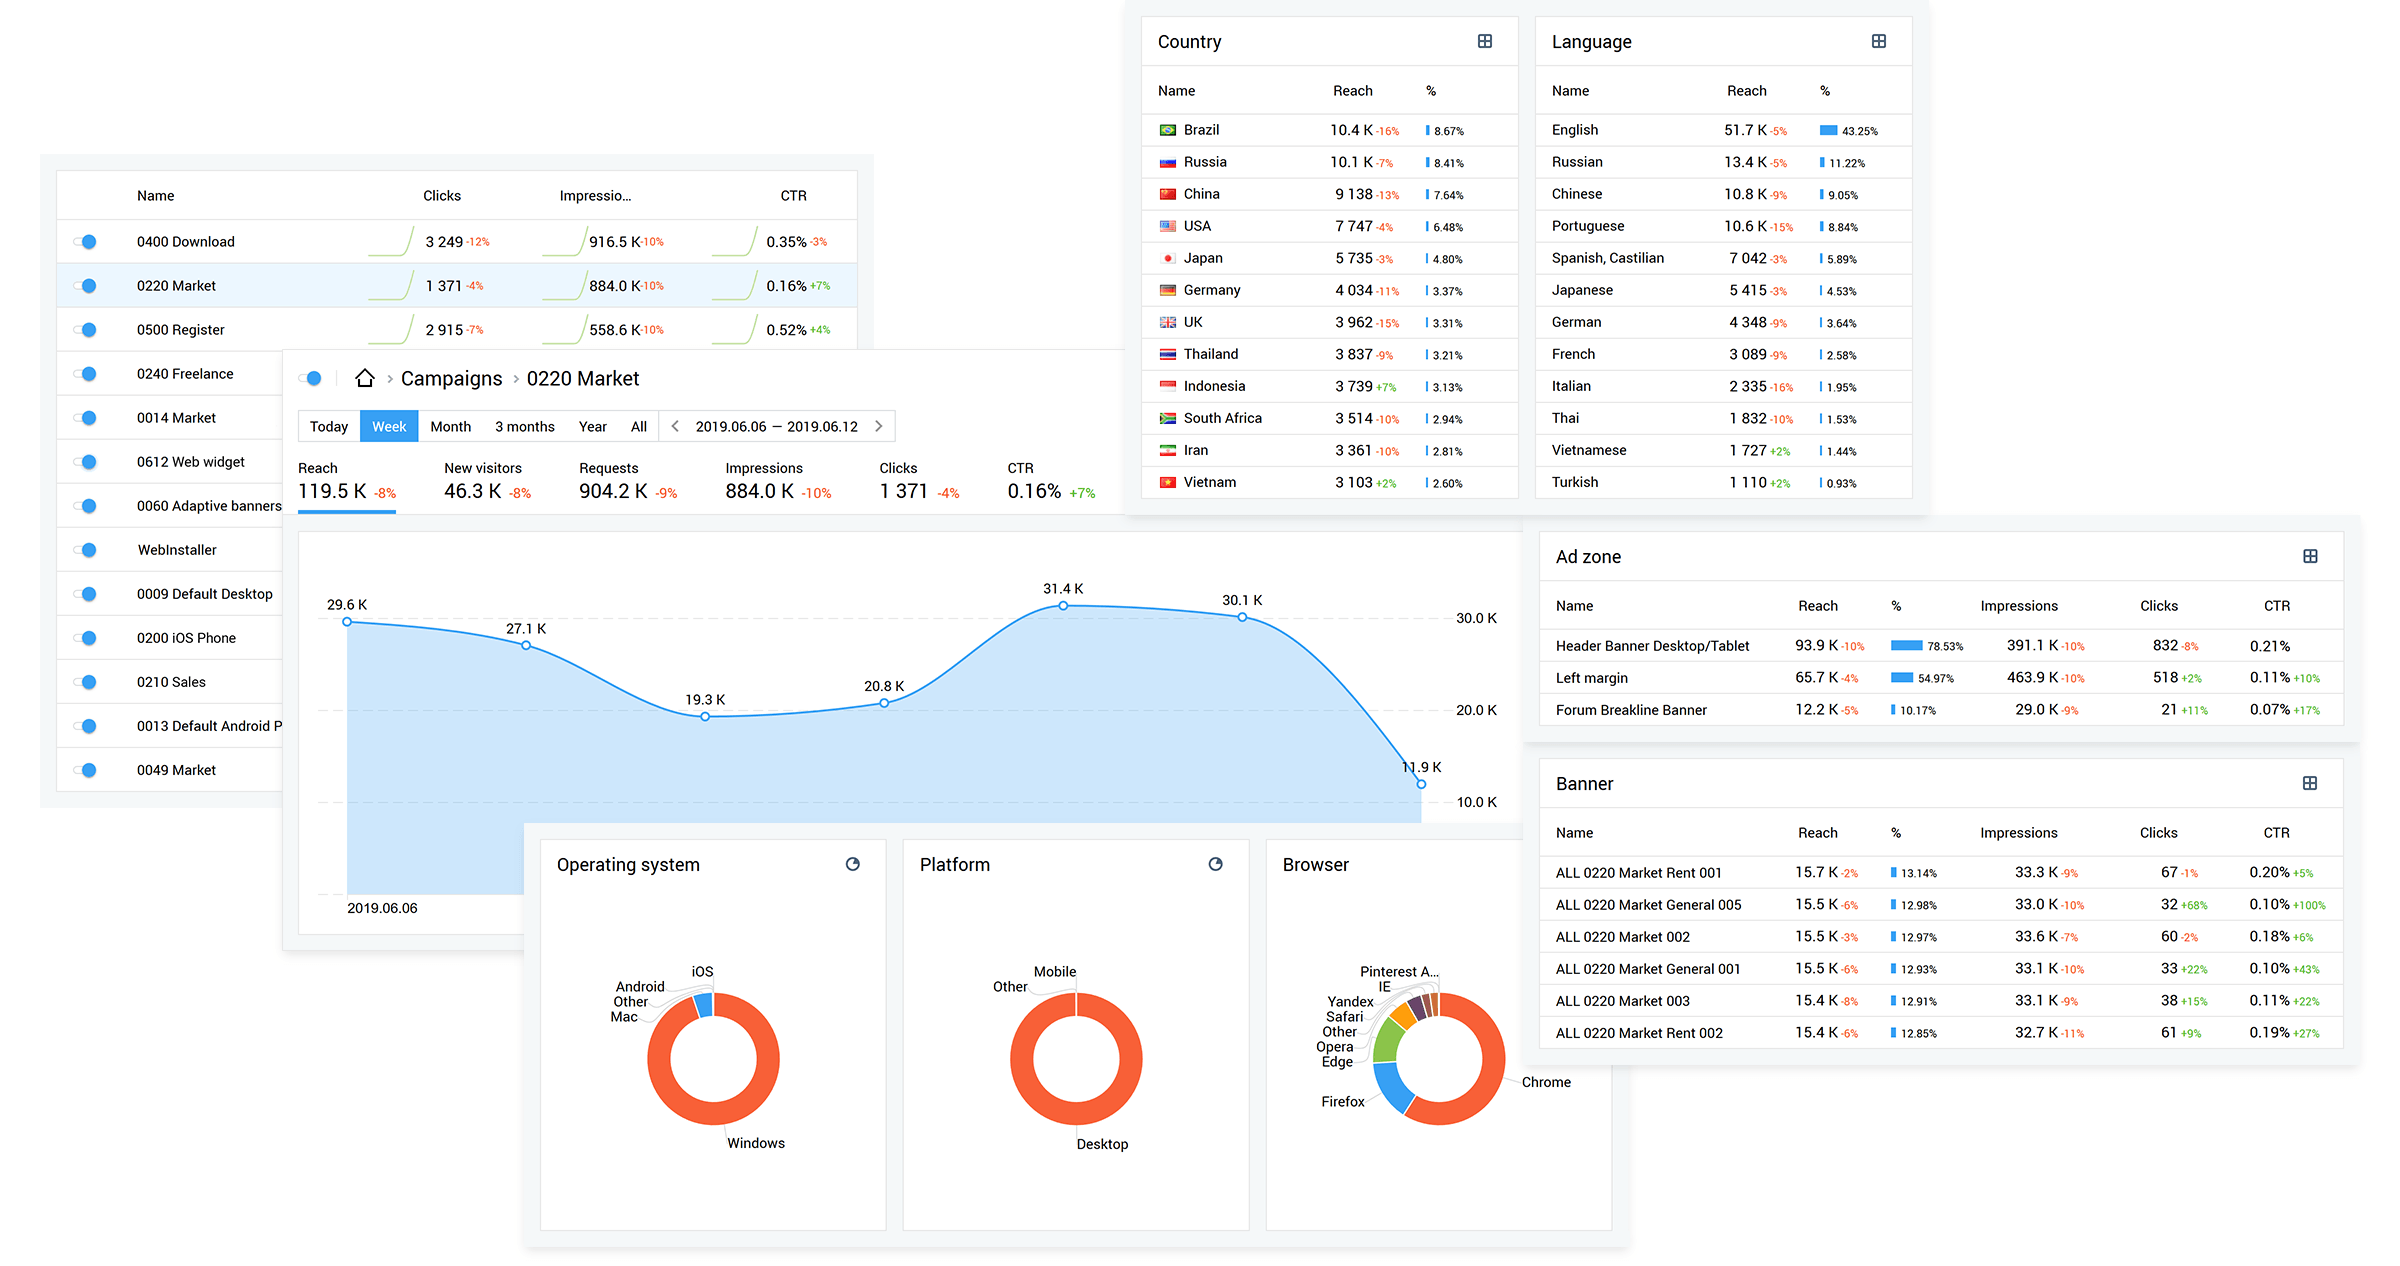
You will start receiving the banner and site performance metrics immediately after launching an ad to maximize your revenue. Track your advertising reach in real time. Reports reflect the relevant click, view, and CTR statistics for every advertising zone so that you know which streams generate the highest revenue.
Which banner ad was the most efficient? On which site pages was it clicked most frequently? Perform comprehensive CTR analysis of your ad reach using a variety of metrics over any time frame, such as referrer, geographical distribution, and spoken language, among others, to take
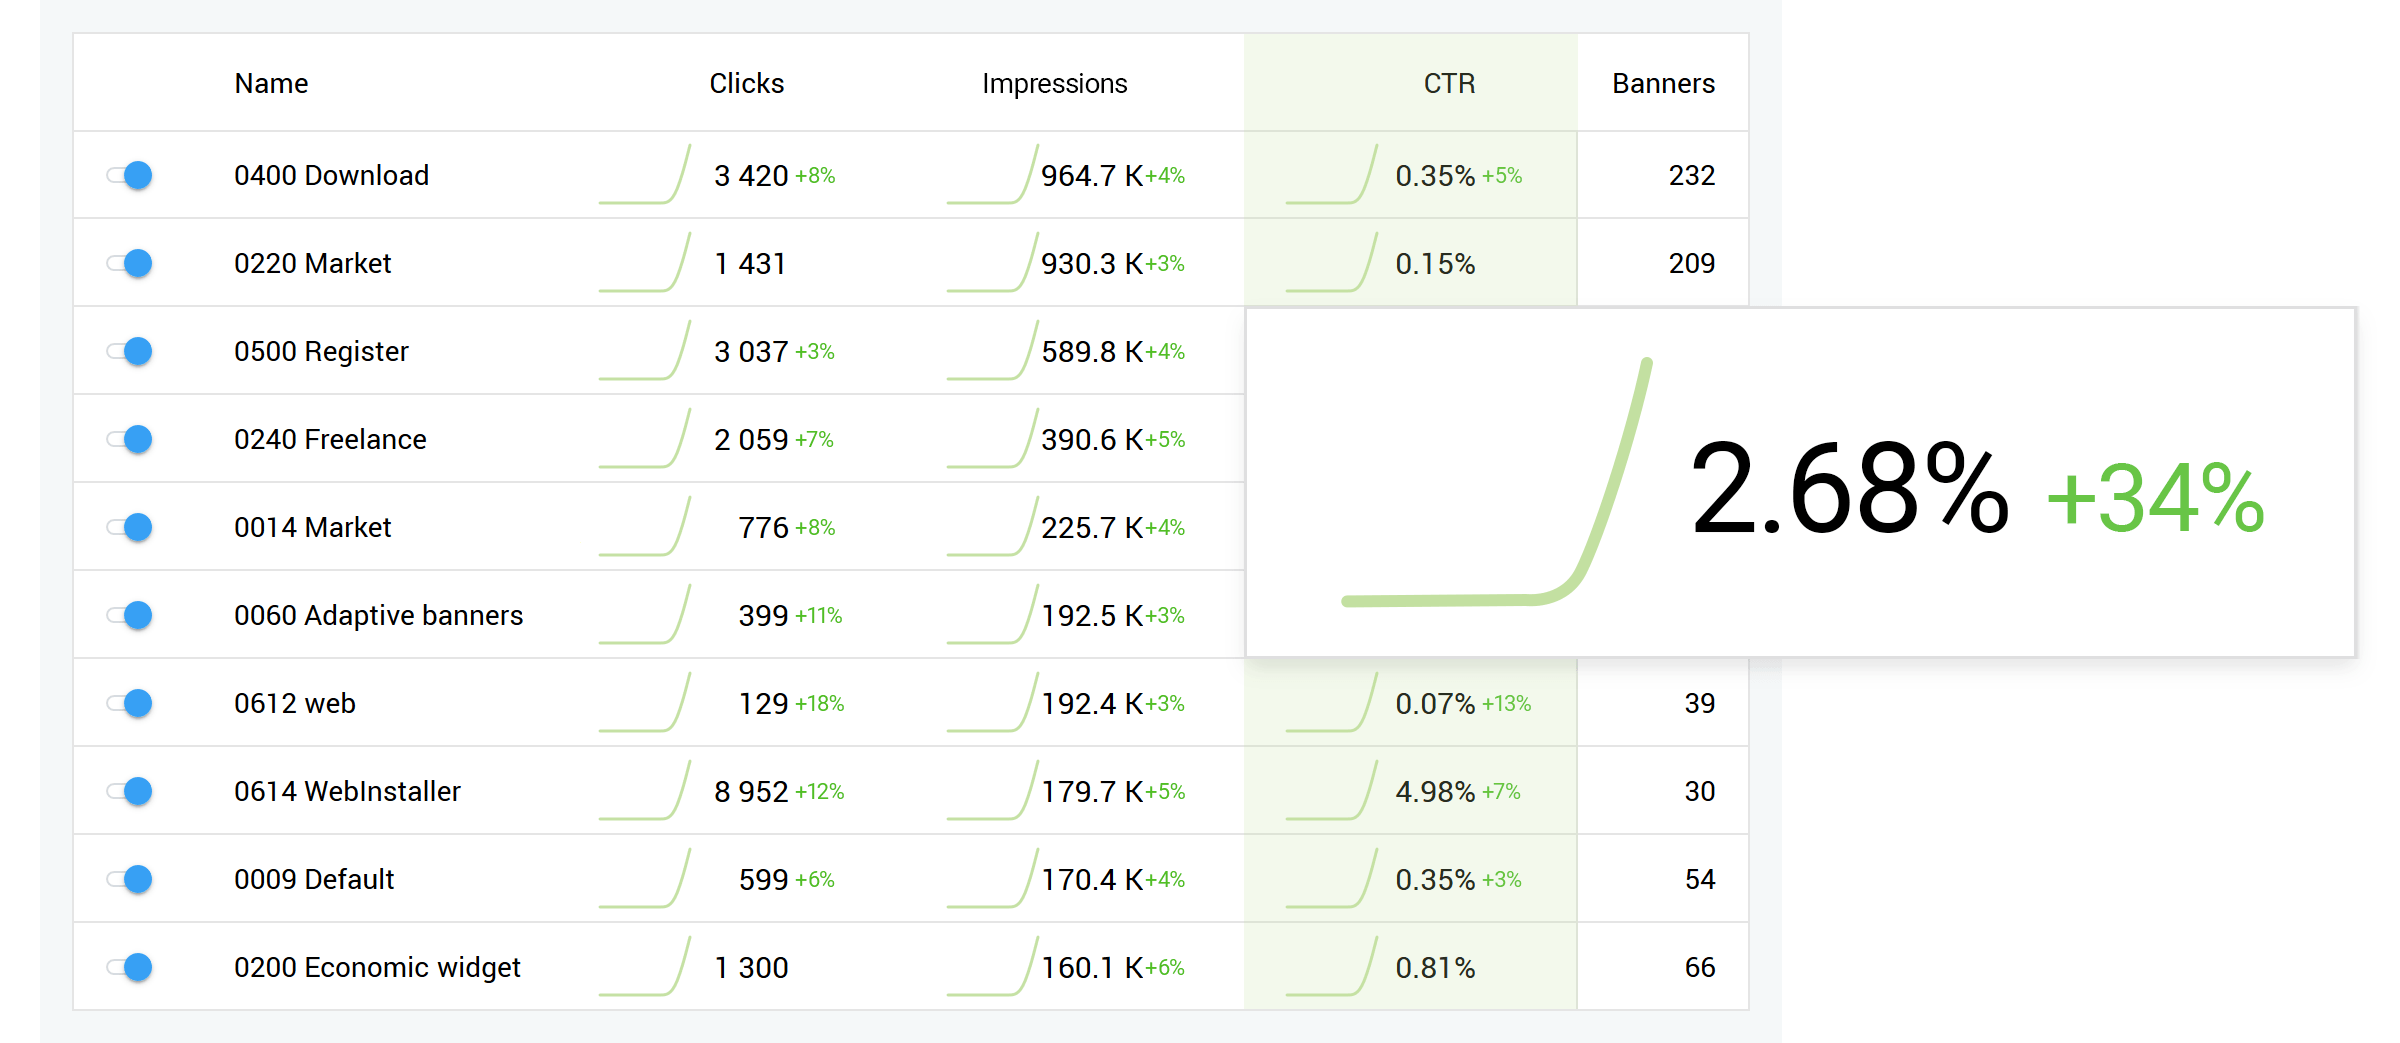
Analyze banner and ad stats and compare performance metrics with the relevant prior period. Hints are displayed in red or green to reflect the change dynamics of each item.
The color indication assists in identifying possible technical problems or inefficient site areas as well as in finding potential growth points affecting future banner or text ad campaigns.

Which of your partners delivers bot traffic? Track the traffic quality of each source and check the affiliates to better analyze banner reach (leading to higher CTRs) and escalate your revenue. The system analyzes the incoming user stream to detect 12 types of bad traffic so that you know which stream has the least banner hits (low CTRs) or the minimum conversions.
All reports generated by Finteza are interactive. You can view banner and ad performance results for any selected user group, advertising material, or the entire advertising reach. With these stats, you can find loopholes and take action to improve CTR and revenue.
Any historical data depth is supported in Finteza: use standard time frames from 1 day to 1 year or specify the desired custom period to track ad reach and compare performance stats such as high vs low CTRs.
To enable efficient ad banner analysis, stats can be presented in the form of charts, tables, histograms and maps. The exceptional functionality makes Finteza an indispensable tool for marketers, webmasters, and analysts to identify and optimize their ad reach.